

An income statement, or profit and loss (P&L) statement, gives an overview of how much money a business made or lost during a specific time. It includes details about revenue, gains, expenses, and losses. Typically found in quarterly and annual reports, it highlights financial patterns, business activities, and period-to-period comparisons.
What’s the Purpose of an Income Statement?
An income statement reveals the financial details of a business. It includes all the money earned and spent during a specific time. Accountants make income statements by comparing trial balances from two different times.
By looking at an income statement and other financial papers, you can figure out:
- If the business is making money.
- If it’s spending more than it earns.
- When expenses are at their highest and lowest.
- How much does it cost to make its product?
- If it has enough cash to reinvest in the business.
Accountants, investors, and business owners often examine income statements to gauge a business’s performance compared to expectations. They use this information to make adjustments. For instance, if a company falls short of its targets, a business owner might change their strategy to do better in the next quarter. Likewise, an investor may choose to sell an investment and invest in a company that is meeting or surpassing its goals.
What’s in an Income Statement?
Although various financial data contribute to understanding a company’s financial well-being, the income statement stands out as a crucial document for both a company’s management team and individual investors. It provides a detailed breakdown of a company’s income and expenses during a specific time frame.
An Income Statement typically has the following key components:
- Revenue: The money earned by the business during the reporting period.
- Expenses: The money spent by the business during the reporting period.
- Costs of Goods Sold (COGS): The cost of the materials or parts used to create the product or service the business sells.
- Gross Profit: The total revenue minus the COGS.
- Operating Income: Gross profit minus operating expenses.
- Income Before Taxes: Operating income minus nonoperating expenses.
- Net Income: Income before taxes minus taxes.
- Earnings per Share (EPS): Net income divided by the total number of outstanding shares.
- Depreciation: The reduction in the value of assets (e.g., equipment) over time.
- Earnings Before Interest, Taxes, Depreciation, and Amortization (EBITDA): A measure of a company’s cash flow, calculated by adding net profit, interest, taxes, depreciation, and amortization.
Companies may break down these categories into smaller items based on their policies and how detailed their income statement is. For instance, revenue can be divided by product or division, and expenses can be detailed as procurement costs, wages, rent, and interest on debt.
Income Statement Analysis
Two common ways to examine a company’s financial data are vertical analysis and horizontal analysis.
Vertical Analysis
Vertical analysis is a way of studying financial statements by expressing each item as a percentage of a base amount within the statement. This means that items on income statements are presented as percentages of gross sales rather than specific dollar amounts.
In simpler terms, it involves looking at a single column of data in a financial statement and understanding how each item relates to the others. For example, it shows the relative size of different expenses by expressing them as a percentage of operating expenses.
This analysis makes it easy to compare financial statements over time and across different industries or companies because it highlights relative proportions. It also helps assess whether performance metrics are getting better.
While vertical analysis may not be as immediately helpful as horizontal analysis, it can guide you in asking important questions like: Where did costs go up or down? Which items are influencing profit margins the most? How do these factors change over time?
Horizontal Analysis
If vertical analysis looks at each line item as a percentage of a base figure in a current period, Horizontal Analysis compares changes in dollar amounts in a company’s financial statements across multiple reporting periods. It is often used for absolute comparisons but can also be presented as percentages.
Horizontal analysis ensures consistency in financial data and reporting according to Generally Accepted Accounting Principles (GAAP). This method enhances the examination of a company’s consistency and growth over time, aiding in comparisons with competitors.
Investors and analysts find horizontal analysis valuable because it helps identify what has influenced an organization’s financial performance over the years. It allows them to observe trends and growth patterns for each line item. In essence, horizontal analysis is utilized to track trends over time, such as comparisons from one quarter to another, rather than showing how individual line items relate to each other.
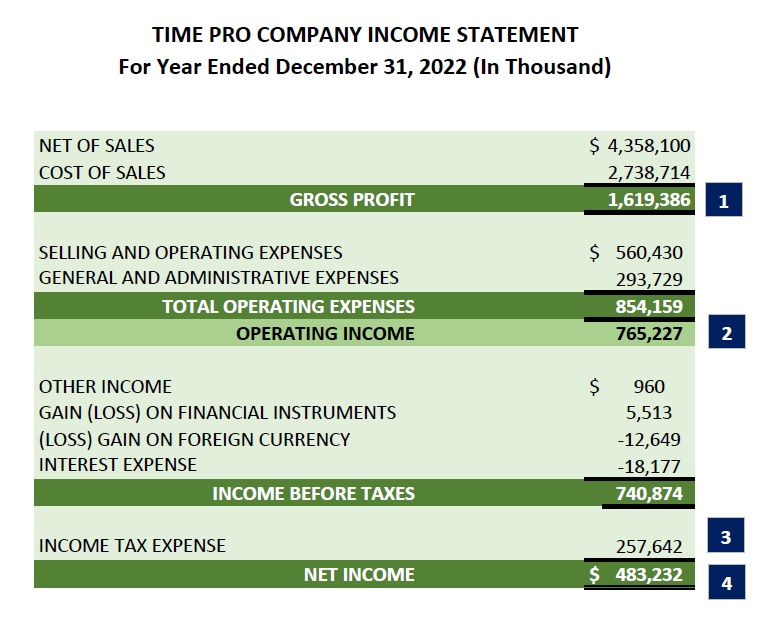
Here’s an example of an income statement of a company named Time Pro for the year that ended on December 31, 2022.
This income statement tells you:
1. Time Pro Company generated $4.36 billion in sales, incurring approximately $2.74 billion in costs to achieve this revenue, resulting in a gross profit of $1.62 billion.
2. After deducting $560.43 million in selling and operating expenses, along with $293.73 million in general and administrative expenses, the company arrived at an operating income of $765.23 million.
3. The operating income was further adjusted with additional gains and losses, including $257.64 million in income tax.
4. At the closing of the fiscal year, Time Pro Company reported a net income of $483.23 million.
Conclusion
The key is not to choose between vertical and horizontal analysis when assessing income statements. Instead, focus on how to use both methods together for smarter decision-making. By combining these approaches and using financial software to conduct deeper analysis, you can gain more valuable insights compared to relying on just one.


